Sunday, May 17, 2015

Unit 7 - The Balance of Payment

Definition
  • Measure of money inflows and outflows between U.S and the rest of the worlth (ROW)
  • Inflow: credits
  • Outflow: debits
  • The balance of payment is divided into 3 account
  • Current account
  • Capital/Financial account
  • Official reserves

Double Entry Bookkeeping
  • Every transaction in the balance of payments is recorded twice in accordance with standard accounting practice. 

Current Account
  • Balance of trade and Net exports
  • Export of goods/services - Imports of goods/services
  • Export create credit
  • Import create debit
  •  
Net Foreign Income
Income earned by U.S owned foreign asset - income paid to foreign held U.S asset

Net Transfers
Foreign aid -> debit to current account

Capital/Financial Account
  • The balance of capital ownership
  • Includes the purchases of both real and financial assets
  • Direct investment in the U.S is a credit to capital account
  • Direct investment by U.S firms/individuals in a foreign country are debit to capital account
  • Purchase of foreign financial assets represents a debit to the capital account

Relationship between Capital and Current Account
  • The current account and Capital account should zero each other out
  • If the current account has a negative balance (deficit), then the capital account should then ahve a positive balance (surplus)

Official Reserves
  • the foreign currency holdings of the U.S Federal Reserve system
  • When there is a balance of payments surplus the Fed accumulates foreign currency and debits the balance of payments
  • When there is a balance payment deficit, the Fed depletes its reserves.

Active vs. Passive Official Reserve
  • The U.S is passive in its use of official reserves. It doesn't seek to manipulate the dollar exchange rate
  • The people's Republic of China is active in its use of official reserve. It actively buys and sell dollars in order to maintain a steady exchange rate with the U.S

Unit 6 - Economic Growth and Productivity

Economic Growth
  • Sustained increase in real GDP over time
  • Sustained increase in real GDP per Capita over time

Why Grow?
  • Leads to greater prosperity for society
  • Lessens burden of scarity
  • Increases the general level of well being

Conditions for Growth
  • Rule of Law
  • Sound legal and Economic Institution
  • Economic freedom
  • Respect for private property
  • Political and Economic Stability
  • Low inflationary expectation
  • Willingness to sacrifice current consumption in order to grow
  • Saving
  • Trade

Physical Capital
  • Tools, machinery, factories, infrastructure
  • Physical capital is the product of invesment
  • Investment is sensitive to interest rate and expected rate of return

Rate of Return
  • It take capital to make capital
  • Capital must be maintained.


Unit 5 - Laffer Curve

Definition
  • A trade off between tax rate and government revenue.
  • Used to support the supply side economic.
  • As tax increase from 0 to some max level then decline

*Criticism of Laffer Curve
  • Research suggest that impact of tax rate on incentive to work, save and invest are small.
  • Tax cut also create demand, which can fill inflation -> demand exceeds supply.
  • Where the economy is actually located on the curve is difficult to determine. 

Reaganomics:
Lower marginal tax rate -> deficit

Unit 5 - Supply-SIde Economics (Reaganomics)

  • Tend to believe AS curve will determine level of inflation, unemployment and economic growth.
  • To increase the economy, you take action to shift AS curve to the right. Always benefiting companies first.
  • Focus on marginal tax rate.
              +The amount paid on the last dollar earned or on each additional dollar.
  • If they reduce marginal tax rate, you encourage more people will work longer, which they will forgo their time for income.
  • Lower taxes are incentives for businesses to invest
  • Lower taxes are incentives for people to increase saving -> create lower interest rate for increases in business investment.

Unit 5 - Long Run Phillips Curve

Because the LRPC exist at the natural rate of unemployment, structural changes in the economy that affect unemployment will also cause LRPC to shift
  • +Increase in unemployment: LRPC ->
  • +Decrease in unemployment: LRPC <-
Changes in the AS/AD model can also be seen in the Philips Curve
Think of changes in AS/AD affects the PC like 2 sets as mirror image
Note:
  • The 2 models are not equivalent. AS/AD model is static. PC includes changes over time. Whereas AS/AD shows one time changes in price level as inflation or deflation.
  • Phillips Curve illustrate continuous changes in price level as either increased inflation or disinflation.

Disinflation
  • Reduction in inflation rate from year to year, usually displayed in LRPC
  • Also occurs when AD declines
  • In short run, profits fall and unemployment increase

Deflation
Actual drop in price level.

Unit 5 - Phillips Curve

Definition:
  • Inverse relationship between inflation and unemployment
  • Only occur in the short run

+Long Run Phillips Curve
  • Occurs at natural rate of unemployment
  • No trade off between unemployment and inflation
  • It only shifts if the LRAS curve shifts
  • Major LRPC assumption is that more worker benefit create higher natural rate and fewer benefit create lower natural rate.
  •  
+Short Run Phillips Curve
  • Has relevant to Okun Law
  • Inverse relationship between inflation and unemployment
  • Since wages are sticky, inflation changes move the point on SRPC
  • If inflation persist, and the expected rate of inflation increases, the entire SRPC moves upward, create stagflation. 
  • If inflation expectation drop due to new technology, SRPC will move downward.
 

Stagflation
High unemployment and high inflation simultaneously

Misery Index
Combination of inflation and unemployment in given year
Single digit misery is good 

Natural Rate of Unemployment
Frictional, Structural and seasonal unemployments


Sunday, March 29, 2015

Videos

Video 1:

The video introduces the types of money. We have 3 types of moneys, commodity, representative and fiat money. Commodity money is the first type of money being used, it can be think of as a fair trade, depend on how both parties set the value, say a cow for a bag of rice, etc. Representative money is the type of currency where we use a metal as a value to trade other goods, for example: gold, silver, bronze. This type of money is not used anymore because of the flexibility in prices of metal, and as the price of metal changes, it will affect the currency of that country. Fiat money is what most countries use today, it is money and has value because the government say so, it is stable since the govt has control over it.

Video 2:

The video explains the supply and demand of money on the Money Market graph. The concept is the same as supply and demand concept, the demand for money will always downward sloping and is affected by the interest rate. Supply for money in the other hand is vertical because it doesn't vary based on the interest rates because it's set and fixed by the Fed. During a recession, the Fed increase the supply of money to remain the interest rate and increase the demand for money.

Video 3:

The video explains the tools of monetary policies include tight and easy money. Expansionary has easy money, the Reserve Requirement and Discount Rate decreases, while actually they both increase. To expand the money supply the FED buys bonds. When trying to contract the money supply the FED will sell bonds

Video 4:

The video  explains the loanable fund market on graph, it is the money available in banking system for people to borrow. The demand for loanable fund is downward sloping as all the supply demand concepts. The supply for loanable funds depend on the savings, the more money saved, the more money bank have to make loans. It's a leakage in income but it is positive for supply of loanable funds when people tend to save more.

Video 5:

The video discussed about the money creating process. Banks make money by loaning money out. When a person deposit a check in to a bank, the bank will keep a certain amount as the reserve the will loan the excess reserves out. The total amount of loan created is through a multiplying expansion. Reserve Ratio is the percentage of banks total requirements. The process of the multiple deposits is to add up all the potential loans.

Video 6:

The video shows the connection between the loanable fund market, money market and the AD-AS graph together. In the money market graph, when the demand for money increase (shift to right), the interest rate increase. When that happens, in the loanable fund, the available money is reduced. That makes the AD increases in AD-AS increase, hence increase the nation's GDP. The fisher effect say the increase in interest rate will increase the inflation. it is a direct relationship.

Unit 4 - Changes in the Supply of Loanble Funds

The supply of borrowing of loan-able funds = savings (low demand for bonds)
->More savings= more supply of loan-able funds (->)
->Less savings = less supply of loan-able funds (->)
EX
-Government budget surplus = more savings= more supply Loan-able funds .: Slf -> .: v
-Decrease in consumers MPS = less saving = less supply of loan-able funds .: Slf <- .:r ^


Final Thoughts on Loan-able Funds
 
-Loanable funds market determines the real interest rate
-When government does fiscal policy it will affect the loan-able funds market
-Changes in the real interest rate (r%) will affect Gross Private investment.
Federal Fund Rate- the interest rate that commercial bank, change other commercial banks for over night
-Discount rate- loans form FED 
-Sister banks- federal fund rate
Prime Rate- the interest rate that is given to a banks most credit worthy consumers
o-4%

Unit 4 - Loanable Fund Market

Loan-able Funds Market

-The Market where savers and borrowers exchange funds (Qlf) at the real rate of interest (r%)
-The demand for loadable funds, or borrowing comes from households, firms, gov't and foreign sector. 
-The demand for loan-able funds is in a fact the supply of bands.
-The supply of loan-able funds of saving comes from households, firms government and the foreign sector. 
-The supply of loan-able funds is also the demand for bonds.
 
Changes in the Demand for Loan-able Funds
-Demand for loan-able funds = borrowing (i.e supplying bonds)
->More borrowing = demand for loan-able funds (->)
->Less borrowing  = less demand for loan-able funds (<-) 


Examples
- Government deficit spending = more borrowing = more demand for loan-able finds .: Dlf -> .: r % ^
- Less investment demand =less borrowing = less demand for loan-able funds.

Unit 4 - Key Principles

A single bank can create money (through loans) by the amount of excess reserves

The banking system as a whole can create money by a multiple (deposit on a money multiplier) of the initial excess reserves


Banks loan out all of the excess reserves
Loans are redeposited in checking accounts rather that taken in cash 

 
Money that was created by the banking system. 
Factors That Weaken the Effectiveness Of the Multiplier

  1. If the Banks fail to loan out all of their excess reserves, FED weak has to change money multiplier
  2. If Bank customers take loans in cash rather new checking deposits creates cash or currency drain.  

Unit 4 - Investment

Investment- We are redirecting resources, that you would consume now for the future.

Financial Asset- claims on property and income of the borrower

Financial Intermediaries- institution that channels funds from savers to borrowers.

Interest in relationship savers, saver is me, and institution is a bank, the bank invests.

3 Purposes for Financial Intermediaries
1. Share risk
-Diversification- spreading out investment to reduce risk

2. Providing Information
-Stock-broker to advise you what to do to see

3. Liquidity
-Easily to convert to cash
-Returns- the money and inverses above and beyond the sum of money that was intentionally invested.

*The higher the risk, the higher the investment bond.

Bonds
3 Components of a Bond
-Coupon rate
-MaturityPar
-Value
-Bonds are Loans or IOUs that represent debt that the Gov't or a cooperation must repay to an invester
-Bonds are generally low risk investments
Coupon Rate
-The interest rate that a bond issuer will pay to a bond holder
Maturity
-The time at which payment to a bond holder is due
 
Par Value
-The amount that an investor pays to purchase a bond and that will be re payed to an investor at maturity
Yield 
-Annual rate of return on a bond of the bond were held to maturity 
Bond you LOAN
Stocks you OWN

Unit 4 - Money

Money- is any asset that can be easily used to purchase goods and services.

Uses of Money:
 As a medium of exchange
- Used to determine value
- You need something to compare cost to
- When you hide money (shoe box, under mattress)
- In a bank it earns interest, at home its the same value
 
Types of Money
Commodity Money - value within its self (Salt, olive oil, gold)
Representative Money- represents something of value
-IOU - pay back worthless paper
 
Fiat Money
- Money because government says so (Paper currency, coins)
 
*Currency is not the same as money
All money is not currency
6 Characteristics of Money
  1. Durability (last long)
  2. Portability ( take it everywhere)
  3. Divisibility (Broken down) ex(1 dollar is 10 dimes)
  4. Uniformity (looks the same, updates)
  5. Limited supply
  6. Acceptability 
Money Supply
- All the available money in the economy 
M1 money- Consists of LIQUID ASSETS
-Easily can convert to cash
-Currency (paper)
-Coin
-Check-able deposits  (checks)
-Travelers Checks
M2 money- Consists of M1 Money + Savings Accounts + money market accounts.
 
3 Purposes for financial Institutions
  1. Store Money
  2. Save Money
  3. Loan Money- Credit card/Mortgage 
4 Ways to Save Money
  1. Savings Account
  2. Checking Account
  3. Money Market Account
  4. CD certificate of Deposit
3+4 Higher interest rate. 

Loans
Banks operate on fractional reserve bank system

Interest Rate
Principal- amount of money borrowed
Interest- price paid for the use of borrowed money
- simple interest- paid on the principal
- compound interest- paid on the principal + the accumulated Interest

Types of financial Institutions

  1. Commercial banks
  2. loans and saving institutions
  3. mutual savings banks
  4. credit unions
  5. financial companies   

Sunday, March 1, 2015

Unit 3 - Fiscal Policy

What is Fiscal Policy
Changes in the expenditures or tax revenues of federal government

Tools of fiscal policy

  • Taxes - government can increase or decrease taxes
  • Spending- government can increases or decreases spending
 Goal: To promote our nation's economic good: full employment, price stability, economic growth

Deficits, Surplus and Debt

Balance budget: Revenues = Expenditures

Budget deficit: Revenues < Expenditures

Budget surplus: Rvenues > Expenditures

Government debt: sums of all deficits

*Government must borrow money when it runs a budget deficit

Government borrows from
-Individuals
-Corporations
-Financial institutions
-Foreign entities or foreign government

Fiscal Policy Options

  • Discretionary Fiscal Policy-think deficit
  • Contractionary Fiscal Policy-think surplus
  • Non-Discretionary Fiscal Policy (no action)
Discretionary vs. Automatic fiscal policies
Discretionary
-Increasing or decreasing government spending and/or taxes in order to return the economy to full employment
-Discretionary policy involves policy makers doing fiscal policy in response to an economic problem

Automatic
-Unemployment + compensation & marginal tax rates are examples of automatic policies that help mitigate the effect of recession and inflation. Automatic fiscal policy takes places with out policy makers having to respond to current economic problems

Contractionary vs. Expansionary
Contractionary
-Strategy to control inflation
-Decrease AD
-Decrease government spending
-Increase taxes

Expansionary
-Strategy to control recession
-Increase AD
-Increase GDP
-Reduce unemployment
-Increase government spending
-Decrease taxes


Automatic or Built- In stabilizers
Anything that increases the government increases its budget deficit during a recession and increases its budget surplus without requirement explicit action by policy makers.


Example: welfare check, food stamping, unemployment checks, corporate dividends, social security, veteran benefits, etc.

Economic Importance
- Taxes reduces spending and AD
- Reductions in spending are desirable when the economy is moving toward inflation
- Increases in spending are desirable toward recession

Tax System
Progressive: Average tax rate rises with GDP

Proportionary: Average tax rate remains constant as GDP changes

Regressive: Average tax rate falls as GDP changes

*Average tax rate = tax revenues / GDP

Unit 3 - Consumption and Saving

Disposable Income

  • Income after taxes or net income
  • DI = Gross Income - Taxes
2 choices
With disposable income, household can either
- Consume (spend money on goods, and services )
- Save (not spend money on goods & services)
Consumption
  • Household spending 
  • The ability to consume is constrained by the amount of disposable income
  • The propensity to save
Do households consume if DI = 0 ?
-Autonomous consumption
-Dis-saving
  • APC = C/ DI =  % DI that's spent 
Saving
  • House hold not spending
  • The ability to save is constrained by the amount of disposable income
  • The propensity to consume
Do house holds save if DI = 0 ?
- No
  • APS = S/DI= % DI that is not spent
APC and APS
  • APC+APS = 1
  • 1-APC = APS
  • 1-APS =APC
  • APC > 1.: Dis-saving
  • APS.: Dis-saving
__________________________________________________________________
MPS and MPC
-Marginal Propensity to consume (MPC)
  • MPC = change in C/ change in DI
-% of every extra dollar earned that is spent
 
-Marginal Propensity to save (MPS)
  • MPS = change in S/ change in DI
-% of every extra dollar earned that is saved
 
- MPC + MPS = 1
-1-MPC=MPS
-1-MPS=MPC
___________________________________________________________________
Spending Multiplier Effect
An inital change in spending (C,Ig,G,Xn) causes a larger change in Aggregate Spending or Aggregate demand
  • Multiplier =change in AD/ hange in spending (C,Ig,G,Xn)
Why does this happen? 
Expenditures and income flow continuously which sets off a spending increase in the economy 
 
Calculating the Spending Multiplier
Can be calculated from MPC or MPS
  • Multiplier = 1/1 -MPC or 1/MPS
*Multipliers are (+) when there is an increase in spending and (-) when there is a decrease in spending

Calculating Tax Multiplier

When the government taxes the multiplier it works inverse because how money is leaving the circular flow
Tax Multiplier (Always going to be negative*)
  • Multiplier = MPC/1-MPS or -MPC/MPS
*If there is a tax-cut, then the multiplier is +, because there is now more money in the circular flow

Unit 3 - Three Schools of Economics

I. Classical

John B. Say
Adam Smith
David Ricardo
Alfred Marshall
What Classical Economics believe in
  • Competition is good
  • Invisible-Hand Market will take care of it's self
  • Say's law supplies creates its own demand 
  • AS- Determines output
  • economy is always close to or always at full employment
  • in the long run the economy will balance at full employment
  • Trickle down effect will help the rich first then help everyone else later
  • savings(leakage)= investment considered an (injection) because we invest
  • prices and wages are flexible downward 
  • no involuntary unemployment
  • no reason you shouldn't be employed 
  • what ever output is produced will be demanded no government intervention 
__________________________________________________________________
II. Keynesian

John Mainer Keynes
What Keynesian Economics believe in
  • Competition
  • AD is key and not AS
  • leaks cause constant recession 
  • savings cause recessions 
  • believed in ratchet effects and sticky wages Block Say's laws
  • In the long run we are all dead
  • demand creates its own supply there fore
  • savers =/ Investment and save for different reasons
  • the economy is not always close to or at full employment
  • prices and wages are inflexible downward
  • mono-plastic competition 
  • there is government intervention
  • fiscal or monetary policy 
_____________________________________________________
III. Monetary 

Allen Green's Span
Ben Bernanke
What Monetary believed in
  • Congress can time policy options
  • government best control the health of the economy, by regulating banks and interest rates
  • easy money- recession
  • tight money- inflation
  • change required reserves if needed
  • Use bands through open market operation
  • use interest rate to change the discount rate, the discount rate, federal fund rate. 

Unit 3 - Investment Demand

What is investment

Money spent of expenditures on:
  • New plant (factories)
  • Capital equipment (machinery)
  • Technology (hardware software)
  • New homes
  • Inventories (goods sold by produces
Expected Rate of Return


How does business make investment decision?
-Cost/benefit analysis


How does business determine the benefits?
-Expected rate of Return

How does business count the cost?
- Interest Cost

How does business determine the amount of investment may undertake?
-Compare expected rate of return to interest cost

*If expected return> interest cost , invest
*If expected return< interest cost then do not invest

Real (r%) v. Nominal (I%) Interest Rate

Nominal is the observable rate of interest. real subtract out inflation (pie%) and is only known ex post factor

Real interest rate (r%)
  • r%= I%- pie% 
 *Cost of an investment decision = the real interest rate (r%)

Unit 3 - Full Employment


Full employment equilibrium exists where AD intersects SRAS & LRAS at the same point

Recessionary Gap

  • A recessionary gap exists when equilibrium occurs below full employment out put
Recessionary gap <- AD decreased


Inflationary Gap
  •  An inflationary gap exists when equilibrium occurs beyond full employment output
Inflationary gap  -> AD increased


Unit 3 - Aggregate Supply

What is Aggregate Supply
The level of real GDP (GDPr) that firms will produce at each price level (PL)
Real GDP= Out put

Long run v Short run AS
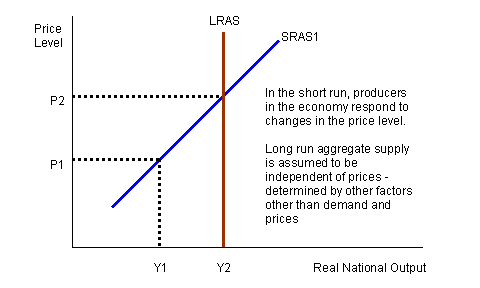
Long Run
  • period of time where input prices are completely flexible and adjustments to change in the price level
  • in the Long run, the level of real GDP supplied is independent of the price level
Short Run
  • period of time when input prices are sticky and do not adjust to changes in the price level
  • in the Short-run, the level of real GDP supplied is directly related to the price level
Long Run Aggregate Supply (LRAS)
  • the long run aggregate supply or in the economy (analogous to ppc)
  • Because input prices are completly flexible in the long-run changes in the price level do not change firm's real profits and therefore. do NOT Change firms level of full employment
 
Short Run Aggregate Supply (SRAS) 
  • Because input prices are sticky in the short run, in the SRAS is upward sloping
  • an increase in  GDPr, a decrease goes to the right and left
  • The key to understand shifts in SRAS is per unit cost of production.

Per unit cost of production
total input/ total output = per unit cost of production


Changes in SRAS (decreases)
Determinants of SRAS (all following affect production cost)
  • input prices
  • productivity
  • legal-institution environment
Input Prices

Domestic Resource Prices
  • Wages (75% of all business cost)
  • Cost of capital
  • Raw material (commodity prices)
Foreign Resource Prices
  • Strong $ = lower foreign resources prices
  • Weak $ = higher foreign resources pries
Market Power
  • -Monopoly and cartels that control resources
  • Increases in resource prices in= SRAS shifts <-
  • Decreases in resource prices= SRAS shifts ->
Productivity
productivity = total out put/ total input

  • more productivity= lower unit production cost = SRAS shifts ->
  • lower productivity = higher unit production cost= SRAS shifts <-
Legal- Institutional Enviornment
  • Taxes ($ to gov't) on business increase per unit production cost = SRAS shifts <-
  • Subsides ($ form gov't) to business reduce per unit productivity cost = SRAS shifts ->
Government Regulation
  • Government regulation creates a cost of compliance = SRAS shifts <-
  • Deregulation reduces compliance cost = SRAS shifts ->

Unit 3 - Consumption

What affects household spending

Consumer wealth

  • more wealth = more spending (AD shifts ->)
  • less wealth = less spending (AD shifts <-)
Consumer expectations
  • Positive expectations = more spending (AD shifts ->)
  • Negative expectations = less spending (AD shifts <-)
Household Indebtedness
  • Less debt= more spending (AD shifts ->)
  • more debt= less spending (AD shifts <-)
Taxes
  • less taxed = more spending (AD shifts ->)
  • more taxes= less spending (AD shifts <-)
Gross Private Investment spending is sensitive to

The Real Interest Rate
  • Lower Real Interest Rate =more investment (AD shifts ->)
  • Higher Real Interest Rate = less investment (AD shifts <-)
Expected Returns
  • High Expected returns =more investment (AD shifts ->)
  • Lower expected returns = less investment (AD shifts <-)

  Expected returns are influenced by
  • Expectations of future profitability
  •  Technology
  • Degree of excess capacity (existing stock of capital)
Government Spending
  • More spending (AD shifts ->)
  • Less spending (AD shifts <-)
Net Exports
  • Net exports are sensitive to:
  • - exchange rates (international value of a $)
  • strong $ = more imports and fewer exports (AD shifts <-)
  • Weak $= fewer imports and more exports=(AD shifts ->)
Relative income
  • Strong foreign economies= more exports =(AD shifts ->)
  • Weak foreign economies = less exports= (AD shifts <-)

Unit 3 - Aggregate Demand

What is Aggregate Demand (AD)?
-Shows the amount of real GDP that the private public and foreign sector collectively desire to purchase at each possible price level

-The relationship between the price level and the level of real GDP is inverse

Three Reasons AD is downward sloping

Real-Balance Effect
-When the Price-level is high household and businesses cannot afford to purchase as much out put.

-When the price-level is low households and businesses can afford to purchase more output
Interest Rate Effect

-A higher price level increases that interest rate which tends to discourage investment

-A lower price level decreases the interest rate which tends to encourage investment

Foreign-Purchase Effect
-A higher price level increases the demand for relatively cheaper imports

-A lower price level increases the foreign demand for relatively cheaper U.S exports

Shifts in Aggregate Demand (AD)
It happens when:
- Change in C, Ig, G, and/or Xn
- Multiplier effect that produces a greater change than the 4 components

*increases in AD= AD ->
*decreases in AD= AD <-

 
Aggregate Demand Curve


AD increased

AD decreased


Sunday, February 1, 2015

Unit 2 - Gross Domestic Product Pt.3

Nominal GDP:
- Value of output produced in current prices
- Adjusted to inflation
- Can increase from year to year if output price increase

+Formula: Price (current year) x Quantity (current year)

Real GDP:
- Value of output produced in constant base year price
- Can only increase from year to year if output increase

+Formula: Price (base year) x Quantity (current year)

Market Basket of Goods: A relatively fixed set of consumer products and services valued and used on an annual basis to track inflation in a specific market or country.

Price Index: Measures inflation by tracking changes in the market basket of goods compare that with the base year.

+Formula:
(Price of market basket of goods (current year)/Price of market basket of goods base year) x 100

GDP deflation: Price index used to adjust form nominal to real GDP

+Formula:
(Nominal GDP/Real GDP) x 100

Inflation Rate formula:
[(New deflator - old deflator) / old deflator] x 100

*In base year, GDP deflator will be 100
  In years after base year, GDP deflator will be > 100
  In years before base year, GDP deflator is < 100


Unit 2 - Gross Domestic Product Pt.2

Expenditure Approach:
The expenditure approach consists of adding up the total of government expenses, consumption, net exports and investment that make up the Gross National Expenditure.
 + Formula:
           C       +                      Ig                        +          G         +      Xn          =   GDP
(consumption) (grss private dos. investment)   (govt.spending)  (net exports)

Income Approach:
The income approach and the output approach use the total of consumption, savings and taxation to yield the same results.
 +Formula:
   W    +   R   +    I     +   P     + Statistical Adjustment*  =  GDP
(wage)  (rent) (interest)(profit) 

*Statistical Adjustment included: 
- Indirect business taxes
-Net foreign factor income earned
-Corporation income tax 
-Dividents
-Undistributed corporation profit

Definition:

-Wage: Compensation of employee, salary supplementary, health, insurances, welfare 

-Rents: Tennet to land lord, a least payment by corporation for the use of their space

-Interest: Money paid by private business to suppliers of loan used to purchase capital

-Profit: Corporate income taxes, undistributed corporate profit, dividend


Unit 2 - Gross Domestic Product

National Income Accounting:
Economist collect statistics on production, income, investment and savings.

Gross Domestic Product (GDP):
It is the most important measure of economic growth, it represents the well being of the domestic economy of a country. It's the total dollar value of all final goods and services produced in that country within a year.

Gross National Product (GNP):
Total value of all final goods and services by citizens of that country on its land or foreign land.

What is included in GDP counting:
-Consumption (take about 67%)
-Gross Private Domestic Investment (construction of housing, factory equipment, unsold inventory of products built in a year)
-Government spending
-Net exports

What is NOT included in GDP counting:
-Intermediate goods (parts of final goods)
-Secondhand or used goods
-Non-market activities (illegal drugs, babysitting, volunteer)
-Financial transaction  (stock, bonds, real estate)
-Gifts (scholarship)
-Transfer payment

Unit 2 - Market Economy

Businesses and households, what is their relationship?

The circular flow diagram displays the relationship of resources and money between the firms, households and government branch through the two markets (factor and products).


 Above are two markets, firms (businesses) and households (we are the households). 
From the household, you will sell your outputs (i.e. labor) to the factor market, where the firms will buy your resources and you will receive the income in exchange for your labor (follow the green arrow).
The firms will use your resources to produce and sell the products to the goods market, where you as the household will buy the final goods and the money that you spent will be the firms' revenue, where they will use part of it to pay for your labor. 
In the middle of the diagram should be the government. The government plays both consumers and producers role in both market. They buy the resources from the factor market and the products from the goods market. They enforce the policies, laws and provide services to both firms and households from the taxes they've collected.

Watch the video for further explanation (:
 
 More info, click here!

Wednesday, January 21, 2015

Unit 1 - Supply and Demand

DEMAND

The relationship between demand and prices is always in inverse. When prices go up, people buy less. When prices go down, they'd buy more.

What is demand?
Demand is the quantity that buyers are willing to able to buy at various prices.

Here is an example of the demand graph. When the price is at its highest, the quantity demanded is at its least. So the cause in change of quantity demanded is the price.

What causes a "change in demand"?
- Change in buyer taste
- Change in population
- Change in income
- Change in price of related goods:
+Substitute goods: goods that serve the same purpose (i.e. cheetos, funyuns)
+Complimentary goods: goods that often consumed together (i.e. tortilla chips, salsa)
- Change in expectation

Normal goods and Inferior goods:
Normal goods: good that buy buy more of when income rise (i.e. beef)
Inferior goods: good that buyer buy less of when income rise (i.e. spam)

SUPPLY

Supply is different from demand, producers want to sell more with a high price. So it is a direct relationship between price and quantity supply.

What is supply?
Supply is a quantity that producer or seller are willing and able to produce/sell at various prices.


 The supply graph above shows the direct relationship between its price and quantity. Ex: the more land you buy, the more it cost you to pay. So the cause in change of quantity supplied is when the price change.

What causes a change in supply?
- Change in technology
- Change in taxes of subsidies
- Change in number of sellers
- Change in resource prices/cost of production
- Change in weather
- Change in expectation

ELASTICITY OF DEMAND

The elasticity of demand tell how drastically a buyer will cut back or buy more

 Elastic demand : E > 1
A product that is elastic when demand will change greatly give small change in price. (want)

 Inelastic demand: E < 1
Demand will not change regardless of price. (need)

Unit elastic: E = 1

Here we have the formula for the Price Elasticity of Demand (PED)
1. (new quantity - old quantity) / old quantity
2. (new price- old price) / old price
3. step 1 / step 2 = PED [take the absolute value only]

Unit 1 - Production Possibility Curve

What is Production Possibility Curve (PPC)?
It is a graph that is showing the most a society can produce if it uses every available sources to the best of its ability. What does it actually mean? It means that we are using all the natural/man made resources efficiently with out wasting any and with full employment.

When to use the Production Possibility Graph?
Assume that there are ONLY 2 goods are produced with FULL employment and fixed resources. It needs fixed state of technology (factory, machines,...) and NO international trade!

 
As the graph shown, the relationship between 2 goods (x and y axis) is described by the opportunity cost.
Opportunity cost is when we choose our next best alternative. Or we can say it as a trade offs, which means we have to give up something to get another.
  • A: the products are attainable but is produced inefficiently, hence it remains inside the curve
  • B: the products are attainable, are produced efficiently but are making more of goods y.
  • C: the products are attainable, are produced efficiently but are making more of goods x.
  • D: both products are attainable and are produced efficiently.
  • X: It's NOT possible to make/produce.
When can we move up to point X?
-Technology improvement
-Economic growth
-Discovering new resources


When are we at point A?
-Decrease in population
-Under employment
-War, famine, disasters,...

Unit 1 - Fundamental Knowledge

What is Macroeconomic?
It is the study of major components of the economy (i.e. inflation, supply and demand, wages, GDP,...) - the very basic info that will come in handy once you have to deal with money and financial matters!

There are some vocab that you will need to know and understand

Positive Economic: It is claim to be very descriptive and based on facts alone.

Normative Economic: It attempts to prescribe how the world should be and is based on opinion.

Needs and Wants: The words explain it all. Need is the basic requirements for survival (i.e. food, shelter, water,...) In other hand, wants are the things that we desire and aren't necessarily needed (i.e. iPod, video games,...)

Scarcity and Shortage
Scarcity is a fundamental economic problem that all society face, because it's trying to satisfying unlimited want with limited resources. 
Shortage is a situation where quantity demanded is greater than quantity supplied. 
-For example: your parents are in a budget and aren't able to buy, say, pork for meal as your family usually do; so your family have to live on ramen noodles for a week before the pay check.

Goods: tangible, can be bought, sold. traded and can be produced

Services: the work that is performed for someone else

Consumer goods and Capital goods

Consumer goods: goods that are intended for final use by consumer (i.e. box of cereal)
Capital goods: items that are used in the creation of other goods, factory machinery (i.e. boxes to store cereal)

Factors of Production
There are 4 factors of production
-Land: natural resources
-Labor: work force
-Capital: +Human capital: knowledge and skill a worker gain through education & experience
               +Physical capital: human made objects used to create other goods & services 
-Entrepreneurship